Rshinydashboard 설치
Rshinydashboard는 shiny 패키지(ver. >=0.11)가 존재해야 설치가 가능하며, 설치명령문은 아래와 같습니다.
install.packages("shinydashboard")Rshinydashboard 기본화면
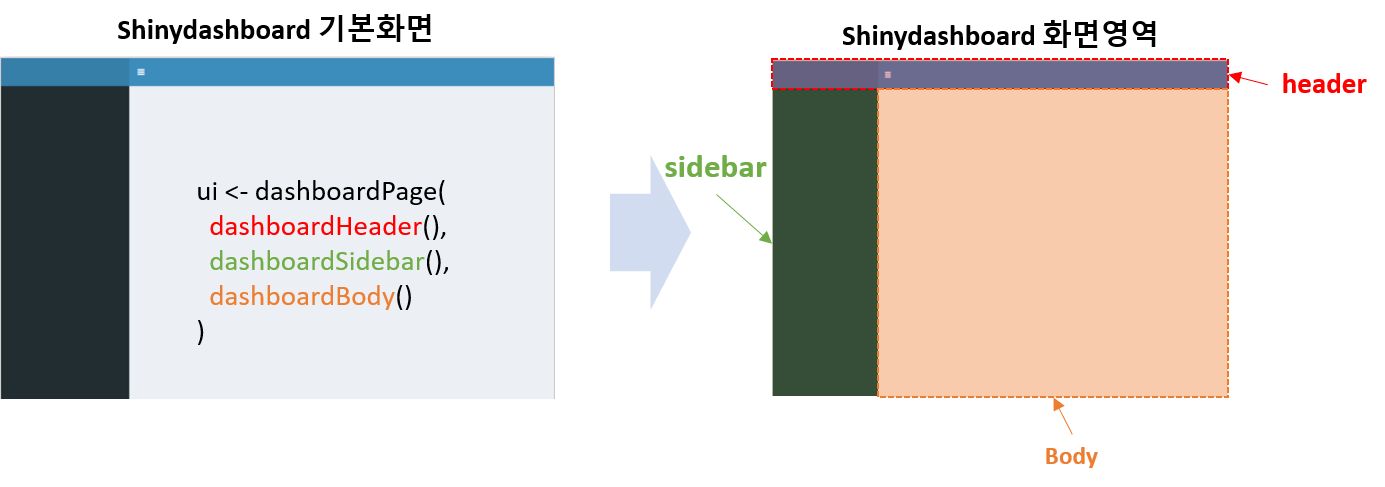
Rshinydashboard는 Header, sidebar, Body영역 등 3개 영역으로 나누어 구성됩니다.
Header 영역은 Title 및 위젯등을 추가가능하며, sidebar영역은 보여주고자하는 컨텐츠를 영역으로 생성할 수 있습니다.(ex. A라는 회사의 전체 매출도 보고싶지만, 일별, 주별, 월별 내용을 보고싶다면 하위메뉴로 나누어 생성할 수 있습니다.)
마지막으로 Body영역은 차트 및 테이블등 보여주고 싶은 내용을 꾸밀 수 있습니다.
Shiny vs Rshinydashboard
shiny의 경우엔 navigation 옵션으로 설정해서 영역을 나눠야 하는 불편함이 있지만, shinydashboard는 해당 부분을 좀더 수월하게 해주는 패키지라고 말씀 드릴 수 있을 것 같습니다.
물론, 저의 지극히 주관적인 의견이라는 점 참고 부탁드립니다.
shiny로 구현했을 때와 shinydashboard로 구현했을 때의 차이점은 아래와 같습니다.
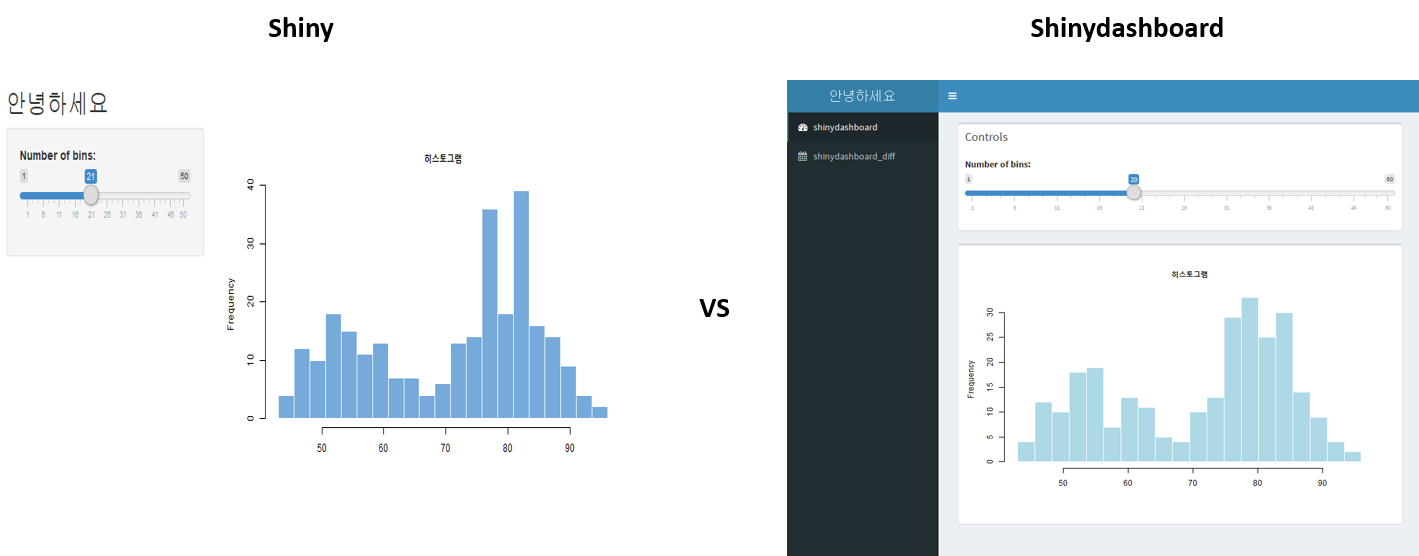
shiny에서도 위에 언급했듯이 각 페이지 구현은 가능하지만, 개인적으론 shinydashboard로 구현했을 때, 더 직관적이었습니다. 아래 그림처럼 말이죠.
위 그림처럼 shinydashboard를 활용하면 sidebar영역으로 각각 나누어 깔끔하게 보고싶은 영역에 대해 정리가 가능합니다.
위의 구현 예시코드는 아래와 같습니다.
## 해당코드는 shinydashboard로 구현하는 코드입니다.

library(shinydashboard)

  ui <- dashboardPage(

    ## Header 영역을 설정합니다.

    dashboardHeader(

        title = "안녕하세요"
    ),

    ## Sidebar 영역을 설정합니다.

    dashboardSidebar(

      sidebarMenu(
          menuItem(enc2utf8("shinydashboard"), tabName = "shinydashboard", icon = icon("dashboard")),
          menuItem(enc2utf8("shinydashboard_diff"), tabName = "shinydashboard_diff", icon = icon("calendar"))
      )

    ),

    ## Body 영역을 설정합니다.

    dashboardBody(
      tabItems(
          tabItem(tabName = "shinydashboard",

            box(
              title = "Controls",
              sliderInput(inputId = "bins",
                          label = "Number of bins:",
                          min = 1,
                          max = 50,
                          value = 30),
              width = 12
            ),
            box(
              width = 12,
              plotOutput(outputId = "distPlot")
            )

          ),

          tabItem(tabName = "shinydashboard_diff",

                  box(
                    title = "Controls",
                    sliderInput(inputId = "bins_2",
                                label = "Number of bins:",
                                min = 1,
                                max = 50,
                                value = 30),
                    width = 12
                  ),
                  box(
                    width = 12,
                    plotOutput(outputId = "distPlot_2")
                  )

          )
      )
    )
  )


server <- function(input, output) {


  output$distPlot <- renderPlot({

    x    <- faithful$waiting
    bins <- seq(min(x), max(x), length.out = input$bins + 1)

    hist(x, breaks = bins, col = "lightblue", border = "white",
         xlab = "",
         main = "히스토그램")

  })

  output$distPlot_2 <- renderPlot({

    x    <- faithful$waiting
    bins <- seq(min(x), max(x), length.out = input$bins_2 + 1)

    hist(x, breaks = bins, col = "red", border = "white",
         xlab = "",
         main = "히스토그램")

  })

}


shinyApp(ui, server)
마지막으로 아래 링크로 shinydashboard에 대한 자세한 내용을 확인 하실 수 있습니다.
comments powered by Disqus